
40 Shots to 19 Before Halftime: How Golden State Won WNBA Finals Game 4

Atlanta shot almost as well as Golden State before halftime. It had 14 turnovers and just eight made field goals.
| Game 4, first half | Golden State | Atlanta |
|---|---|---|
| Field goals made / attempted | 17 / 40 | 8 / 19 |
| Field-goal percentage | 42.5% | 42.1% |
| Turnovers, including team turnovers | 4 | 14 |
| Offensive rebounds | 8 | 3 |
| Points | 42 | 26 |
Source: FCB’s half-by-half data, calculated from the official Game 4 play-by-play.
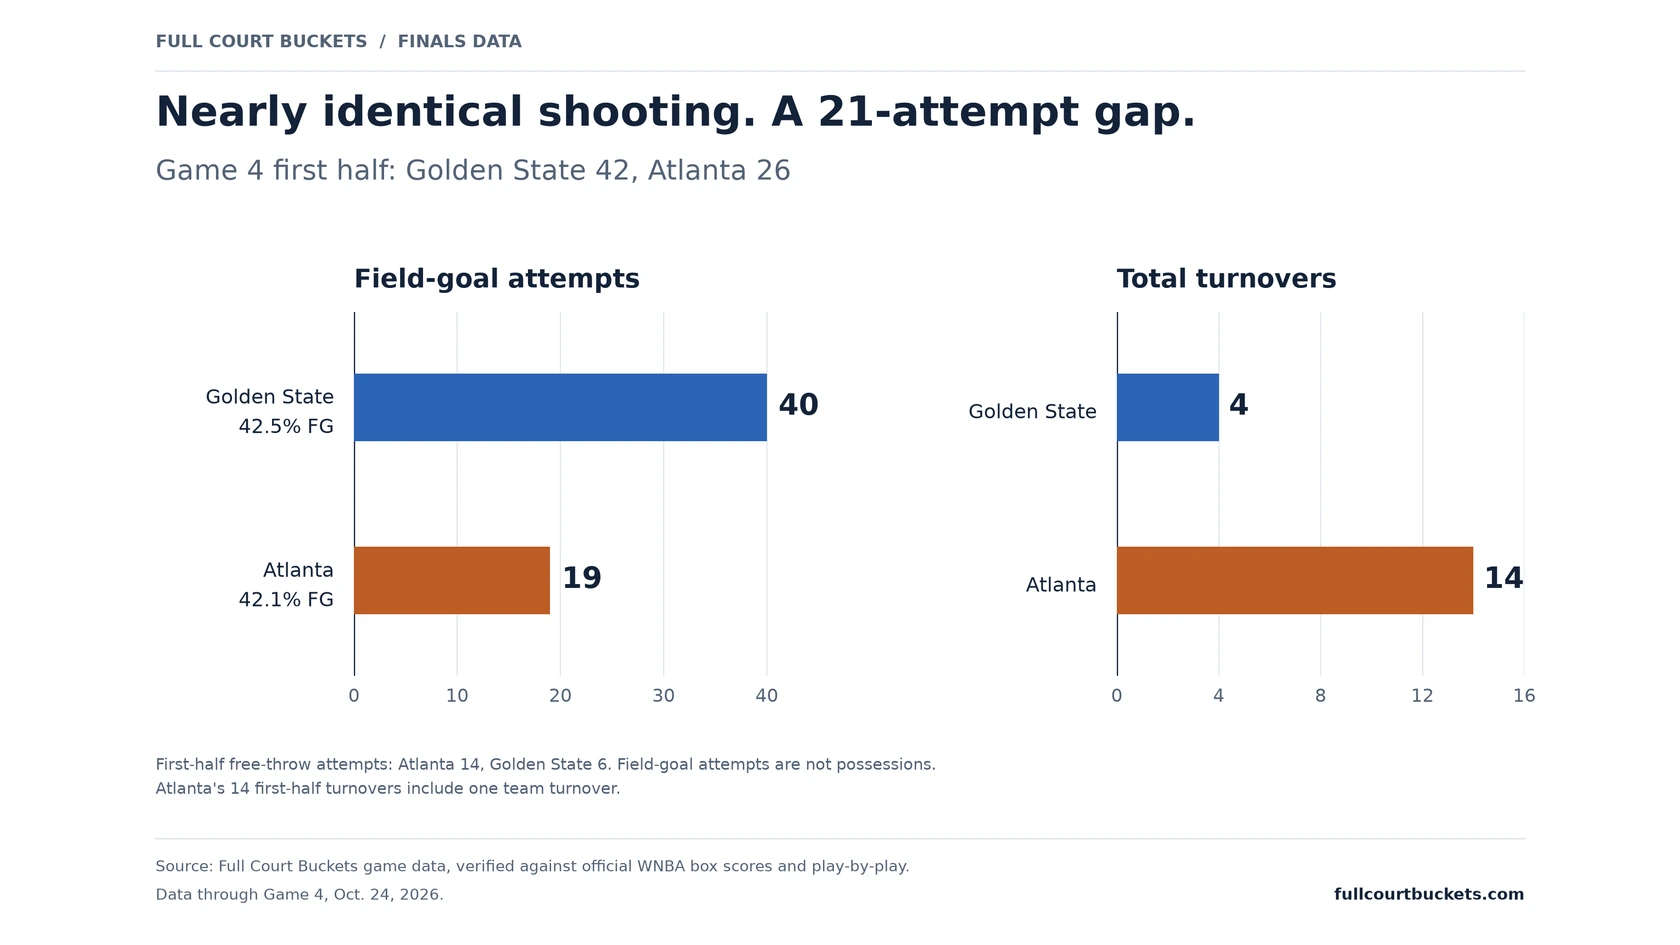
Golden State made 42.5% of its field-goal attempts in the first half of Game 4. Atlanta made 42.1%. The Valkyries still reached halftime with a 42–26 lead after attempting 40 field goals to the Dream’s 19.
Atlanta committed 14 turnovers before the break, then cut that number to four in the second half. Its comeback fell short, 67–62, leaving the WNBA Finals tied 2–2.
Full Court Buckets’ analysis of the official box scores and play-by-play found a pattern across all four games: the team with fewer turnovers has won every time. In both Golden State victories, its advantage in points off turnovers exceeded its final winning margin.
Data for reporters: Game 4 by half · All four games by half · All four games · Downloadable chart
The first-half gap: 14 turnovers, eight made baskets
Atlanta attempted more free throws, 14 to six, which accounts for part of the field-goal-attempt gap. But it also committed 10 more turnovers and collected five fewer offensive rebounds.
After halftime, Atlanta won the field-goal-attempt count 35–32 and outscored Golden State 36–25. Its shooting percentage actually fell to 28.6%. The Dream generated more attempts and more free-throw points while sharply reducing their giveaways.
Every halftime leader has won, and Atlanta owns the second halves
| Game | Halftime score | 1st-half FGA, ATL–GSV | 1st-half turnovers, ATL–GSV | 2nd-half score | Final |
|---|---|---|---|---|---|
| 1 | Golden State 42–39 | 33–37 | 5–6 | Golden State 26–25 | Golden State 68–64 |
| 2 | Atlanta 39–37 | 34–31 | 8–8 | Atlanta 40–28 | Atlanta 79–65 |
| 3 | Atlanta 46–40 | 38–32 | 6–10 | Atlanta 51–31 | Atlanta 97–71 |
| 4 | Golden State 42–26 | 19–40 | 14–4 | Atlanta 36–25 | Golden State 67–62 |
The team leading at halftime has won all four games. Golden State has built both of its wins before the break, leading by a combined 19 points at halftime in Games 1 and 4, then being outscored by 10 after it.
After halftime, the series has belonged to Atlanta. The Dream have won three of four second halves and outscored Golden State 152–110 after the break, while trailing 161–150 in first halves. Golden State has taken exactly 140 field-goal attempts in each half of the series, but made 58 before halftime (41.4%) and 38 after it (27.1%). Atlanta has attempted 67 second-half free throws to Golden State’s 31.
Game 4’s 14 first-half turnovers were not part of a series-long pattern. Atlanta had fewer first-half turnovers than Golden State in Games 1 and 3 and the same number in Game 2.
Source: FCB’s half-by-half data for all four games, calculated from official play-by-play and reconciled to full-game totals.
After halftime, Golden State stops finishing inside
| Shots inside 15 feet | First halves, Games 1–4 | Second halves, Games 1–4 |
|---|---|---|
| Golden State | 38 / 73 (52.1%) | 23 / 79 (29.1%) |
| Atlanta | 33 / 69 (47.8%) | 34 / 77 (44.2%) |
| Golden State threes | 19 / 61 (31.1%) | 11 / 51 (21.6%) |
Golden State’s second-half slump is mostly a two-point problem. It has taken more shots inside 15 feet after halftime than before, but has made 15 fewer. Atlanta’s inside shooting has barely changed between halves.
Source: FCB shot-zone data and every shot, Games 1–4, classified from play-by-play shot descriptions.
Steals have cost far more than dead-ball turnovers
| Turnover type, Games 1–4 | Turnovers | Opponent points within 24 seconds | Points per turnover |
|---|---|---|---|
| Live-ball (credited steal) | 61 | 78 | 1.28 |
| Dead-ball (no steal) | 48 | 36 | 0.75 |
| Atlanta live-ball | 29 | 35 | 1.21 |
| Golden State live-ball | 32 | 43 | 1.34 |
A steal has been worth about 1.7 times as many points to the opponent as a dead-ball turnover. Golden State’s 14 live-ball turnovers in Game 2 produced 20 Atlanta points. Rhyne Howard leads the series with 12 steals, none in Game 4.
Game 4 broke that pattern for Atlanta. Ten of its 18 turnovers were dead-ball. Angel Reese’s six were three bad passes, two offensive fouls and a travel; only two were steals, and Golden State scored three points within 24 seconds of them.
Game 1’s last five minutes: Atlanta made 1 of 10 shots
| Game 1, final 5:00 | Golden State | Atlanta |
|---|---|---|
| Points | 11 | 4 |
| Field goals | 2 / 7 | 1 / 10 |
| Three-pointers attempted | 2 | 5 |
| Free throws | 7 / 8 | 2 / 2 |
| Turnovers | 3 | 1 |
Atlanta led 60–57 with five minutes left in Game 1. It missed its last nine field-goal attempts, three of them blocked, and did not score after Howard’s free throws with 3:12 left. Gabby Williams scored eight of Golden State’s 11 points in that stretch, six on free throws. Her free throws with 1:18 left gave the Valkyries a 65–64 lead.
Source: Game 1 closing-stretch data, calculated from the official Game 1 play-by-play.
Golden State led the final 35:49 of Game 4
| Game | Lead changes | Ties | Largest lead, ATL | Largest lead, GSV | Biggest run |
|---|---|---|---|---|---|
| 1 | 7 | 6 | 9 | 5 | Atlanta 11–0 |
| 2 | 14 | 13 | 21 | 6 | Atlanta 11–0 |
| 3 | 0 | 2 | 26 | 0 | Atlanta 8–0 (twice); Golden State 8–0 |
| 4 | 1 | 2 | 5 | 16 | Golden State 12–0 |
Game 4 had one lead change. Atlanta led 7–2 before Golden State’s 12–0 run in the first quarter. Kiah Stokes’ layup with 4:11 left in the quarter put the Valkyries ahead 9–7, and they never trailed or were tied again. Golden State never led in Game 3.
Source: scoring runs and lead tracker, from play-by-play scoring.
An eight-point edge off turnovers in a five-point win
Golden State scored 16 points off turnovers in Game 4; Atlanta scored eight. On all other scoring, Atlanta led 54–51.
The same split appeared in Game 1. Golden State won the points-off-turnovers category 17–8, while Atlanta led 56–51 on all other points.
| Golden State victory | GSV margin in points off turnovers | GSV margin in all other scoring | Final winning margin |
|---|---|---|---|
| Game 1, 68–64 | +9 | −5 | +4 |
| Game 4, 67–62 | +8 | −3 | +5 |
| Combined | +17 | −8 | +9 |
Across its two wins, Golden State has outscored Atlanta 33–16 off turnovers while being outscored 110–102 on all other points. That is how the recorded scoring divides up; it does not tell us what would have happened if the turnovers had never occurred.
Eight more two-point baskets outweighed Atlanta’s free throws
Golden State finished Game 4 with 72 field-goal attempts to Atlanta’s 54. Those 18 additional attempts were not 18 additional possessions: Atlanta attempted 31 free throws to Golden State’s 13, and offensive rebounds also affected the shot count.
Golden State won despite shooting 4-for-25 from three. Both teams made four threes, but the Valkyries made 22 two-point baskets to Atlanta’s 14, a 16-point advantage. Atlanta made 22 free throws to Golden State’s 11, recovering 11 of those points. The remaining five were the final margin.
Four games, four wins for the team with fewer turnovers
| Game | Result | Turnovers, ATL–GSV | Points off turnovers, ATL–GSV |
|---|---|---|---|
| 1 | Golden State 68–64 | 12–10 | 8–17 |
| 2 | Atlanta 79–65 | 14–19 | 24–13 |
| 3 | Atlanta 97–71 | 10–17 | 22–7 |
| 4 | Golden State 67–62 | 18–9 | 8–16 |
Across the four games, winners have committed 43 turnovers to the losers’ 66 and scored 79 points off turnovers to the losers’ 36.
The series totals hide those swings. Atlanta has 54 turnovers and Golden State 55, almost a tie. The difference has been their distribution from game to game.
The sharpest reversal came between Games 3 and 4. Atlanta went from a 22–7 advantage in points off turnovers to an 8–16 deficit, a 23-point swing toward Golden State. The Valkyries scored four fewer points than in their Game 3 loss and still won Game 4.
Four games establish a pattern in this series, not a guarantee for Game 5.
Reese’s split shows how much Atlanta’s offense has changed
Angel Reese finished Game 4 with eight points on 2-for-12 shooting and six turnovers, one-third of Atlanta’s team total. Her production has differed sharply between the Dream’s two wins and two losses.
| Reese through Game 4 | Atlanta wins, Games 2–3 | Atlanta losses, Games 1 and 4 |
|---|---|---|
| Points per game | 25.5 | 11.0 |
| Field goals | 17 / 28 | 7 / 23 |
| Field-goal percentage | 60.7% | 30.4% |
| Rebounds per game | 14.0 | 10.5 |
| Turnovers per game | 2.0 | 5.0 |
Rhyne Howard led Atlanta with 19 points in Game 4. Her defensive contribution also changed: she recorded 11 steals across Atlanta’s two wins and none in Game 4.
Golden State’s own scoring has barely moved: 67.5 points per game in wins, 68 in losses. Atlanta has averaged 88 in wins and 63 in losses. The Valkyries have won twice without a scoring surge. Atlanta’s offense has been the much larger variable.
Download and reuse the data
FCB’s original charts, calculations and compiled data tables are free to use and republish.
- Team statistics, Games 1–4 (CSV)
- Game 4, first and second halves (CSV)
- All four games, first and second halves (CSV)
- Reese and Howard, Games 1–4 (CSV)
- Every turnover, with type, steal and opponent points within 24 seconds (CSV)
- Turnovers by type, team and player (CSV)
- Every field-goal attempt with shot zone (CSV)
- Shot zones by team, game and half (CSV)
- Scoring runs of 8+ points (CSV)
- Lead changes, ties and largest leads (CSV)
- Game 1 final five minutes (CSV)
- Combined data and methods (JSON)
- First-half chart (PNG)
- Golden State’s winning margins chart (PNG)
- Data definitions and calculation notes
Methods and sources
This analysis covers the four completed games of the 2026 WNBA Finals through Oct. 24. Full-game figures were checked against the official WNBA box scores linked above. Half-by-half counts for all four games were calculated from Full Court Buckets game data, checked against official WNBA play-by-play, and reconciled to full-game totals.
Turnovers include both player turnovers and team turnovers. Golden State’s Game 1 total is eight player turnovers plus two team turnovers; Atlanta’s Game 4 total is 17 plus one.
Shot zones use the distance or shot type in each play description: rim (0–4 feet, layups, dunks, tips), short (5–14 feet, floaters, hooks), midrange (15+ feet, two-pointers) and threes. Thirty attempts without a distance or type took their distance from the official play-by-play. “Opponent points within 24 seconds” counts the other team’s points in the 24 game-clock seconds after a turnover, in the same quarter. It is FCB’s per-turnover measure. It matches the official points-off-turnovers total exactly in six of eight team-games and totals 114 against the official 115. A live-ball turnover is one with a credited steal.
“All other scoring” means final points minus the official points-off-turnovers total. These are mutually exclusive scoring categories, not an estimate of the causal cost of turnovers. Field-goal attempts, free-throw attempts and possessions are different measures. Player shooting percentages use combined makes divided by combined attempts, not an average of individual game percentages.
Source credit: Full Court Buckets game data, verified against official WNBA box scores and play-by-play.
How this story was made: Full Court Buckets articles are written by Ryan Moalemi, sometimes with AI assistance, and every stat is checked against official WNBA box scores and the sources cited in the story. How we make Full Court Buckets
Full Court Buckets · WNBA News. Analysis. Commentary.